A platform transparency report is a document a platform publishes about its own actions, using its own definitions, on its own schedule. Nobody audits the definitions before publication. That is not an accusation. It is the structure of the genre, and it decides how much weight any figure in one of these reports can carry.
The gap between what these reports measure and what people assume they measure is wide enough to break a client conversation. An enforcement report counts what the platform did about its own rules. It does not count how much reach a business account can expect. A regulatory database counts the notices platforms are legally obliged to file. It does not count social media specifically.
This piece reads four published reports against their own definitions pages, then states what their figures support and where they stop. Every number below carries its source, its window and what it is expressed against.
A transparency report and a reach report answer different questions
Three kinds of platform-published report get called “a transparency report” in conversation, and each one measures something different.
- An enforcement report measures the platform’s own moderation actions against its own rules. LinkedIn’s Community Report is one. Its current edition states its scope in its own first line: it covers content removed for violating LinkedIn’s Professional Community Policies and User Agreement “during the six-month period between July 1 and December 31, 2025”, plus copyright removal requests. LinkedIn Corporation publishes it. The page carries no publication date of its own, and the server reported the page last modified on August 21, 2026 when I retrieved it on August 24, 2026.
- A reach report measures what surfaced in a feed over a stated window. Meta publishes one for Facebook, titled “Widely Viewed Content Report: What People See on Facebook”, in its Transparency Center.
- A regulatory filing or database measures what a law obliges the platform to disclose, on the regulator’s definitions rather than the platform’s. The European Commission’s DSA Transparency Database collects statements of reasons that Article 17 of the Digital Services Act requires hosting providers to give users, and that Article 24(5) requires online platforms to send to the Commission (DSA Transparency Database Questions and Answers, European Commission, retrieved August 24, 2026).
Google’s YouTube Community Guidelines enforcement report sits in the first group, and it is the best-documented of the four. Google publishes its counting rules separately, in the YouTube Community Guidelines Enforcement FAQs and the YouTube Community Guidelines enforcement visible changes log inside the Transparency Report Help Center.
The report the headline came from decides the answer
An agency lead gets forwarded a press headline about a platform removing millions of accounts. The client attached one line: “should we be worried?”
The honest answer starts by identifying which report the headline came from. If the figure came from an enforcement report, it measures the platform’s actions against its own rules. It carries nothing about the risk profile of a compliant business account, because enforcement reports do not measure distribution and do not model risk for account types they never break out.
Use an enforcement report when the question is what the platform did. Do not use an enforcement report when the question is how much reach a business account can expect. The report does not measure distribution at all, and no amount of careful reading will make it.
Platform Watch collects platform changes read against the platforms’ own statements, and the same discipline applies to every figure in that archive.
What a published figure counts, and against what
A single figure in one of these reports needs five things established before it can be quoted: what it counts, what it is counted against, the exact window it covers, its geographic and surface scope, and whether it is a count, a rate, a sample-based estimate or a modeled figure.
LinkedIn’s fake-account figures show why the second one matters most. LinkedIn’s Community Report states that “our automated defenses blocked 97.8% of the fake accounts we stopped during the July – December 2025 period, with the remaining 2.2% stopped by our manual investigations and restrictions”, and that “99.7% of the fake accounts were stopped proactively, before a member report” (Community Report, LinkedIn, reporting period July 1 to December 31, 2025, retrieved August 24, 2026).
Read the denominator in that sentence. It is fake accounts LinkedIn stopped. It is not fake accounts on LinkedIn. The 97.8% figure describes the composition of a set LinkedIn defined by having caught it, so it says nothing about the accounts LinkedIn did not catch. The same page reports the community as “over 1.3 billion members in more than 200 countries and territories worldwide”, and the 97.8% is not expressed against that base either.
A solo social media manager running six accounts for one B2B client reads a rate expressed per ten thousand views and repeats it as a share of posts. Those are two different denominators supporting two different claims. A rate against views supports a statement about what viewers encountered. The same rate supports nothing about what share of posts broke a rule.
Figure type is the fifth check and the one most often skipped. YouTube’s Violative View Rate is not a count. Google’s own FAQ describes it as a sample: reviewers assess a sample of viewed videos, and Google uses “the aggregate results to estimate the proportion of views on YouTube that violate our Community Guidelines”. The metric is reported with a 95% confidence interval, and Google adds that “the confidence intervals do not take into account rater quality” (YouTube Community Guidelines Enforcement FAQs, Google, retrieved August 24, 2026).
Scope hides in the same FAQ. YouTube assigns a video’s country or region from “the uploader’s IP address at the time of upload”, and Google states plainly that this data does not distinguish a genuine location from a VPN or proxy, and that the uploader’s IP “does not necessarily correspond with the location where the video was viewed or the location from which a video was flagged”. A country breakdown in that report is a breakdown of upload origin, not of audience.
The definitions pages, not the headline summaries, are the part of these reports worth a practitioner’s hour. Google publishes its counting rules in a help-center FAQ that the report itself only links to. The DSA Transparency Database publishes its field definitions in an API and schema documentation page, and that page is where the difference between two similar-sounding automation fields becomes visible. Its example payload carries automated_detection as a Yes or No field and automated_decision as a separate field with three values: AUTOMATED_DECISION_FULLY, AUTOMATED_DECISION_PARTIALLY and AUTOMATED_DECISION_NOT_AUTOMATED (retrieved August 24, 2026).
Hold those two fields apart. The next section depends on them.
A worked read of a stat panel that says more than the numbers do
The DSA Transparency Database homepage carries a block headed “Overview of the Database”. Its numeric tiles are the most-quoted figures the database produces, and the block’s presentation invites a reading its numbers do not support.
Here is the block as published, retrieved August 24, 2026 at https://transparency.dsa.ec.europa.eu/ .
The block opens with one scoping sentence: “Below you can find some summary statistics on the statements of reasons submitted by providers of online platforms to the Commission in the last six months (180 days, see the Data Retention Policy for details).”
Below that sentence sit four tiles. Three carry a number above a label:
- 3 703 748 843, labeled “Total number of statements of reasons submitted”
- 365, labeled “Number of active platforms”
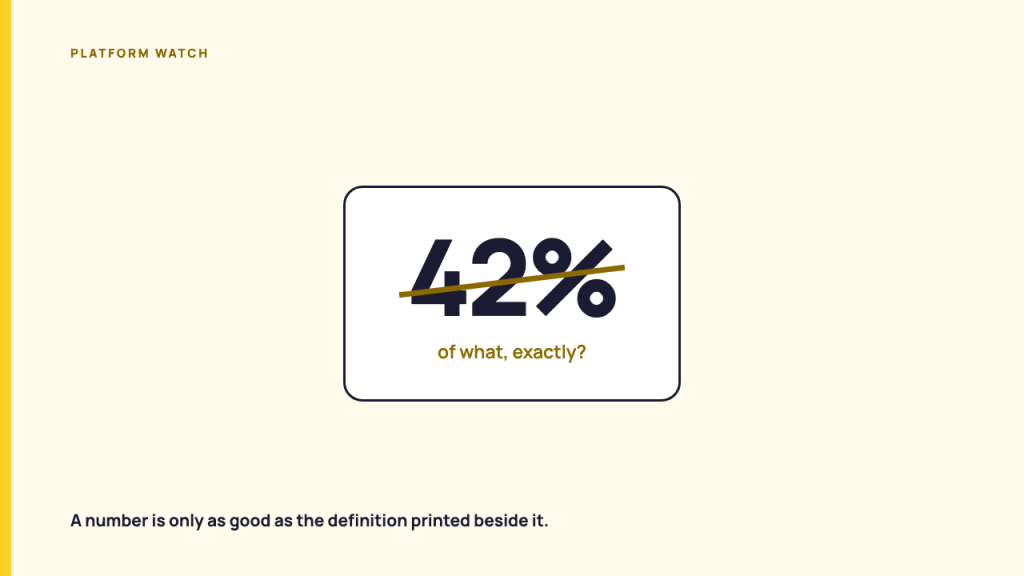
- 42%, labeled “of fully automated decisions”
The fourth pair of tiles are ranked lists with no numbers attached. “Most Reported Violations” reads: “Other violation of provider’s terms and conditions”, “Unsafe, non-compliant or prohibited products”, “Consumer information infringements”. “Top Restriction Types” reads: “Disabling access to content”, “Removal of content”, “Other restriction (please specify)”.
The presentation choice that does the work: the word “Total” sits on a tile whose window is a rolling 180 days, and none of the three numeric tiles repeats the window in its own label. The scoping sentence appears once, above the block, in body text. A screenshot of the tiles alone, which is how these figures usually travel, carries no window at all.
The wider claim the presentation invites: platforms have submitted 3.7 billion content moderation decisions to the EU, and 42% of content moderation is now fully automated.
The narrower claim the numbers support: in the 180 days before retrieval on August 24, 2026, providers of online platforms submitted 3,703,748,843 statements of reasons to the DSA Transparency Database, 365 platforms were active in that window, and 42% of the statements submitted in that window recorded a fully automated decision. Nothing in the block supports an all-time total. Nothing in it supports a claim about content moderation in general.
Two further limits sit on the same numbers, and both come from the publisher.
The 42% is about decisions, not detection. The database schema keeps automated_decision and automated_detection as separate fields, and automated_decision has three values rather than two (API and schema documentation, retrieved August 24, 2026). A reader who takes 42% as “42% of moderation is done by machines” has merged the fully and partially automated buckets and has also merged decision automation with detection automation. The tile label says “fully automated decisions” and means exactly that.
The database is not a social media database. The Commission’s own Q&A defines online platforms as a subset of hosting services and gives its examples as “online marketplaces, app stores, or social networks” (DSA Transparency Database Questions and Answers, retrieved August 24, 2026). Two of the three entries in the panel’s own “Most Reported Violations” list are product and consumer categories rather than speech categories. A social media manager who quotes the 3.7 billion figure as social media moderation volume has quoted a number whose largest contributors the panel itself indicates are not social networks.
A two-person agency handling twelve client accounts across three platforms put the 42% tile in a quarterly client update, then had to walk it back when the client opened the schema page. The retraction cost more credibility than the slide ever earned.
This panel supports the direction of a change only when the window and the definitions held constant across the periods compared. It supports nothing about magnitude over time, because the block itself only ever shows one rolling window and never plots a series.
The mechanism here is a labeling and scoping choice. Whether anyone intended the panel to read as an all-time total is unknown, and nothing on the page indicates intent either way.
A second mechanism, on a chart rather than a panel
YouTube’s channel-terminations series breaks for two non-behavioral reasons that land in the same quarter, and Google documents both in its own change log.
Its September 2025 entries state that beginning with the April to June 2025 reporting period, Google “updated the way we calculate channel terminations across a reporting period” so that a channel is counted once “even if it has multiple Community Guidelines violations”, and that certain deceptive-practices channel terminations moved into “Spam, deceptive practices, and scams” from the “Misinformation” category where they previously sat (YouTube Community Guidelines enforcement visible changes, Google, retrieved August 24, 2026).
A quarterly bar chart of channel terminations therefore has a counting break and a category break at the same point. A fall in the total across that boundary is consistent with fewer channels being terminated and equally consistent with the same channels being counted once instead of several times. The chart cannot separate the two, and neither can anyone reading it.
When the number moved because the definition moved
An apparent movement between two editions of the same report has four candidate causes, and platform behavior is the last one to reach for. The other three are a definitional change, a scope change and a reporting-period change. All four of the reports read here document at least one of the first three inside the last two years.
LinkedIn’s current edition changed what a removal is. A footnote under its “Content removed” chart reads: “Beginning this reporting period, we’ve updated our methodology to count original pieces of content, excluding instant reposts”, and LinkedIn defines an instant repost as a post shared without any additional content. The surrounding text is explicit that this is part of why the volumes moved: “Changes in volume in this reporting period reflect our continued investments in our defenses, as well as an adjustment to how we measure reposted content” (Community Report, LinkedIn, reporting period July 1 to December 31, 2025, retrieved August 24, 2026). A comparison of content-removal volume across that boundary is not a comparison of the same quantity.
Google goes further and tells readers not to compare editions at all. Its FAQ answer to “What causes changes in the data between reports?” lists service-level changes, changes in user numbers, external events and differences in reporting periods, then concludes: “Therefore, report-by-report comparisons may not accurately reflect time-based improvements in our processes” (YouTube Community Guidelines Enforcement FAQs, Google, retrieved August 24, 2026). The publisher of the numbers has published a warning against the most common use of them.
Google’s change log also shows a metric moving because a policy moved. Its June 2025 entry states that in late Q1 2025 Google “strengthened our policies related to online gambling content, which caused a slight increase in Violative View Rate” (visible changes log, retrieved August 24, 2026). The rate rose because the rule changed, not because viewers changed.
The DSA Transparency Database changed its submission schema on a stated date. Its announcement of July 1, 2025 records that the schema was updated to match the Implementing Regulation on Transparency Reporting, that from that day all statements of reasons must use the updated schema, and that statements submitted before July 1, 2025 “remain available according to the old schema” (Announcements, DSA Transparency Database, announcement published July 1, 2025, retrieved August 24, 2026). The dashboard instructions add that the violation terminology was updated on the same date, that pre-July-2025 statements are displayed with the old terminology, and that a correspondence table between old and new terms exists (Dashboard, DSA Transparency Database, retrieved August 24, 2026).
Published figures get revised, sometimes years later
The most useful thing on the DSA database’s announcements page is an error notice. Published June 8, 2026, it states that because of a technical error, “the field indicating whether a violation was detected via automated means was inverted” for a portion of Google Play records, that the inversion ran “from September 2023 to May 2026”, and that the issue “was remediated as of 29 May 2026” (Announcements, DSA Transparency Database, retrieved August 24, 2026).
Note which field. The inverted field is the detection field, not the decision field, so the homepage’s “fully automated decisions” tile is not the figure this notice contaminates. Any automated-detection breakdown that includes Google Play records from that 32-month span is the figure it contaminates. Getting that distinction right is the difference between a correct caveat and a wrong one.
A second notice, published November 19, 2025, records that Meta identified and fixed an issue on October 27, 2025 under which statements of reasons from Facebook and Instagram sourced from Trusted Flaggers “might not have been labelled as such”, with the fix applying to submissions from October 28, 2025 onward. Any Facebook or Instagram flagger-source breakdown for a window before that date undercounts Trusted Flagger provenance.
Older revisions on the same reports make the same point as historical record. Google’s change log entry of May 2024 revised the July to September 2023 reporting period after reporting bugs. Comment removals for that quarter moved from 842,831,976 as originally published to 893,635,095 as revised, and video reinstatements moved from 31,183 to 26,483 (visible changes log, Google, entry dated May 2024, retrieved August 24, 2026). Those are 2023 figures revised in 2024, and they are cited here only as evidence that revision happens, not as current numbers.
| Reporting period July to September 2023 | Originally published | Revised |
|---|---|---|
| Comment removals, total | 842,831,976 | 893,635,095 |
| Video reinstatements, total | 31,183 | 26,483 |
Source: YouTube Community Guidelines enforcement visible changes, Google, entry dated May 2024. Historical record, not current figures.
LinkedIn publishes its corrections the same way, in footnotes. One footnote records that an earlier version of the report gave 232 thousand spam and scam removals for January to June 2021 and that the correct figure is 224 thousand. Another records that a harassment or abusive content figure for the same period moved from 147,156 to 158,988 (Community Report, LinkedIn, retrieved August 24, 2026). Both are 2021 figures, cited here as historical record of the revision practice.
The European Commission’s own documentation currently disagrees with itself on one point, which is worth knowing before quoting either page. The database’s Data Retention Policy, version 2.0, effective February 18, 2025, states that daily dump files “will be available for download for a period of 5 years after their creation date”, and that this replaced a previous version and extended the retention “5 years instead of 18 months”. The Commission’s Q&A page still states that daily dumps “will be retained for 18 months (540 days)”. Both pages were retrieved on August 24, 2026. The policy page names itself as the newer document, so it is the one to cite, and the discrepancy is a reminder that a publisher’s FAQ can lag its own policy.
What these reports can support, and what they cannot
Seven findings below come from the figures read above. Each one names the figure it rests on, then states the claim that figure supports and the adjacent claim it does not.
- LinkedIn’s 97.8% automated-defenses figure for July to December 2025 supports a claim about the composition of the fake accounts LinkedIn stopped in that period. It does not support a claim about how many fake accounts exist on LinkedIn, because the denominator is accounts LinkedIn caught.
- LinkedIn’s 99.7% proactive figure for the same period supports a claim about how many of those stopped accounts were stopped before a member report. It does not support a claim about detection speed, which the report does not measure.
- LinkedIn’s 95% copyright acceptance rate for July to December 2025 supports a claim about reported infringements acted on, which the table gives as 3,530 removed out of 3,723 reported. It does not support a claim about requests granted, because the same table records 2,955 requests, and LinkedIn’s own footnote states that requests often cite multiple infringements.
- The DSA database figure of 3,703,748,843 statements of reasons supports a claim about submissions in the 180 days before August 24, 2026. It does not support an all-time claim, and it does not support a claim about social media, because the database covers online platforms including marketplaces and app stores.
- The 42% fully-automated-decisions figure supports a claim about the decision-automation field for statements submitted in that window. It does not support a claim about automated detection, which the schema keeps as a separate field, and it does not include partially automated decisions.
- YouTube’s Violative View Rate supports a claim about the estimated share of views on violative videos, with a 95% confidence interval that excludes rater quality. It does not support a claim about spam, which Google omits from the metric entirely, and it does not support a claim about livestreams, which the metric excludes unless they were converted to on-demand videos.
- YouTube’s per-policy removal counts support a claim about the primary removal reason reviewers assigned. They do not support a claim about how many videos broke each rule, because Google’s FAQ states that a video violating more than one guideline is assigned the reason for the most severe violation.
None of the seven tells you what a normal number looks like for your own accounts. That is a separate question with its own trap, and it is the subject of benchmarking when every industry average is invented.
The things these reports do not measure at all
Enforcement reports are silent on reduced distribution, and YouTube’s report says so in one sentence.
A social lead assumes an enforcement report will show whether a platform quietly cut a video’s reach rather than removing it. YouTube’s FAQ lists three restrictions short of removal: age restriction, limited features, and locked as private. Videos with limited features “remain available on YouTube but will be placed behind a warning message”, with sharing, commenting, liking and “placement in suggested videos” disabled. Then the FAQ states: “The above actions to restrict videos are not included in the report at this time” (YouTube Community Guidelines Enforcement FAQs, Google, retrieved August 24, 2026).
That absence is documented rather than inferred. The report’s own scope statement excludes exactly the enforcement action a practitioner most wants to see. Why the exclusion exists is not stated on the page, and nothing there indicates intent.
Four further absences sit in the same FAQ and its sibling documents.
- YouTube’s comment data excludes creator moderation and collateral removals. The report “only includes data on comments YouTube removed for violating our policies or filtered as ‘likely spam’”, and excludes comments removed when a creator disables the comment section, when a video is removed, when a channel is suspended, and when a commenter’s account is terminated.
- YouTube’s report excludes legal, privacy and copyright removals, which Google routes to its Government requests to remove content report and its copyright reporting instead.
- Google’s government-requests data excludes child sexual abuse imagery removals, because Google states it cannot accurately track which of those were government-requested, and excludes the removals Google processes daily in response to non-governmental complaints. It also cannot include reports filed through a web form where the requesting party is unidentifiable (Government requests to remove content FAQs, Google, retrieved August 24, 2026).
- The DSA Transparency Database excludes redress options and personal data, and it collects from online platforms only rather than from every hosting service (DSA Transparency Database Questions and Answers, European Commission, retrieved August 24, 2026).
An absence is publishable when the report’s own scope or definitions section shows it. An absence is not publishable as a claim about what a platform is hiding, because the documents read here evidence the first and never the second.
What an enforcement report does not tell you about restriction risk, actual restriction triggers sometimes do. That evidence is collected in what actually triggers a restriction on a business account.
LinkedIn’s Community Report is silent on the feed. It reports removals, fake accounts, spam and copyright, and it publishes nothing about how content is distributed. LinkedIn has written about distribution elsewhere, and what LinkedIn’s own engineering posts say about the feed collects those statements.
Every reading is anchored to an edition
These reports are reissued on a schedule, so a reading has a shelf life and a figure quoted from a superseded edition is a dated figure.
The cadences differ. LinkedIn’s Community Report covers six-month periods, and its current edition covers July 1 to December 31, 2025. YouTube’s enforcement report uses quarterly reporting periods, which its change log labels by quarter. The DSA Transparency Database updates daily, at 06:00 CET according to its dashboard instructions, and keeps individual statements searchable for 180 days while the dashboard holds five years of aggregated data.
A figure carried forward without reopening the current edition is a stale figure. The revision notices above are the reason: a number can be correct on the day it is quoted and wrong six months later, without anyone touching the quote.
[INLINE: quiet newsletter module, theme default. No lead magnet, no gated asset.]
Frequently asked questions
What is a platform transparency report?
A platform transparency report is a platform’s published account of its own actions under its own rules. LinkedIn’s Community Report, for example, states in its opening line that it covers content removed for violating LinkedIn’s Professional Community Policies and User Agreement during a stated six-month period. The platform writes the definitions, chooses the reporting period and publishes on its own schedule.
What is the difference between a transparency report and a reach report?
A transparency or enforcement report measures the platform’s moderation actions against its own rules, such as content removed, accounts restricted and appeals reinstated. A reach report measures what surfaced in a feed over a stated window, which is a different object entirely. Meta publishes both kinds, an enforcement report and the Widely Viewed Content Report for Facebook, and a figure from one answers nothing about the other.
Why do the numbers change between editions of the same report?
Numbers change between editions for four reasons, and platform behavior is the last one to check. The three to rule out first are a change in the metric’s definition, a change in scope, and a change in the reporting period. LinkedIn’s current Community Report changed how it counts removals, excluding instant reposts, and says the volume change reflects that adjustment as well as its defenses. Google’s FAQ goes further and states that report-by-report comparisons may not accurately reflect improvements in its processes.
Can a platform’s enforcement figures tell me whether my account is at risk?
You cannot read account risk out of an enforcement report, because the report measures actions the platform took, not the exposure of any account type. YouTube’s report makes the limit explicit in two ways: it assigns each removed video a single most-severe removal reason rather than every rule it broke, and it excludes age restriction, limited features and locked-as-private actions from the report entirely. Neither the totals nor the categories describe a compliant business account’s odds of being restricted.
Where is the methodology section in these reports?
The methodology lives under a different label on every one of these reports, and it is rarely on the report page itself. Google publishes YouTube’s counting rules in two Transparency Report Help Center articles, the Community Guidelines Enforcement FAQs and the visible changes log. The DSA Transparency Database splits its definitions across a Documentation section, an API and schema page, a Data Retention Policy and an Announcements page. LinkedIn carries its definitions in asterisked footnotes under each chart and in the linked Professional Community Policies, with no section called methodology at all.
Read the next edition better than the last one
LinkedIn’s Community Report will next cover a six-month period, and the first thing worth checking in it is not a headline number. Check whether the instant-repost exclusion introduced for July to December 2025 is still in force, because that decides whether the new content-removal figure can be compared with the last one. Then check the footnotes for corrections to figures already published, since LinkedIn revises in footnotes rather than in the body.
Do the same on the others. Open the definitions before the summary, note the window on every figure you copy, and record which edition you read.
More reports read the same way sit in the archive of platform changes read against the platforms’ own statements.
Source ledger
Every URL below was fetched during the drafting of this post on August 24, 2026. “Retrieved” is the fetch date. “Document date” is the date the document itself states, where it states one.
| # | Source | URL | Document date | Retrieved |
|---|---|---|---|---|
| 1 | LinkedIn Community Report | https://about.linkedin.com/transparency/community-report | No publication date stated. Reporting period stated as July 1 to December 31, 2025. HTTP Last-Modified: 2026-08-21 | 2026-08-24 |
| 2 | YouTube Community Guidelines Enforcement FAQs, Google Transparency Report Help Center | https://support.google.com/transparencyreport/answer/9209072?hl=en | No date stated on page | 2026-08-24 |
| 3 | YouTube Community Guidelines enforcement visible changes, Google | https://support.google.com/transparencyreport/answer/9198203?hl=en | Most recent dated entry: December 2025 | 2026-08-24 |
| 4 | Government requests to remove content FAQs, Google | https://support.google.com/transparencyreport/answer/7347744?hl=en | No date stated on page | 2026-08-24 |
| 5 | YouTube Community Guidelines enforcement report (landing page) | https://transparencyreport.google.com/youtube-policy/removals | Renders client-side. No body content retrieved. | 2026-08-24 |
| 6 | DSA Transparency Database homepage, incl. “Overview of the Database” panel | https://transparency.dsa.ec.europa.eu/ | Figures are a rolling 180-day window as of retrieval | 2026-08-24 |
| 7 | DSA Transparency Database, Dashboard and instructions | https://transparency.dsa.ec.europa.eu/dashboard | States terminology update effective 1 July 2025 | 2026-08-24 |
| 8 | DSA Transparency Database, Announcements | https://transparency.dsa.ec.europa.eu/page/announcements | Entries dated 08/06/2026, 19/11/2025, 01/07/2025, 03/06/2025, 17/02/2025 and earlier | 2026-08-24 |
| 9 | DSA Transparency Database, Data Retention Policy v2.0 | https://transparency.dsa.ec.europa.eu/page/data-retention-policy | Effective 18 February 2025; date of release 17 February 2025 | 2026-08-24 |
| 10 | DSA Transparency Database, API and schema documentation | https://transparency.dsa.ec.europa.eu/page/api-documentation | No date stated on page | 2026-08-24 |
| 11 | DSA Transparency Database, Explore Data Overview | https://transparency.dsa.ec.europa.eu/explore-data/overview | No date stated on page | 2026-08-24 |
| 12 | DSA Transparency Database Questions and Answers, European Commission | https://digital-strategy.ec.europa.eu/en/faqs/dsa-transparency-database-questions-and-answers | No date stated on page | 2026-08-24 |
| 13 | Meta, Widely Viewed Content Report (Transparency Center) | https://transparency.meta.com/data/widely-viewed-content-report/ | Title and publisher confirmed from page metadata. Body renders client-side; no content retrieved. | 2026-08-24 |
| 14 | Meta, Community Standards Enforcement Report (Transparency Center) | https://transparency.meta.com/reports/community-standards-enforcement/ | Title confirmed. Body renders client-side; no content retrieved. Not cited in the body. | 2026-08-24 |
| 15 | X, Rules Enforcement report page | https://transparency.x.com/en/reports/rules-enforcement.html | Fetched; report data renders client-side. Not cited in the body. | 2026-08-24 |
Sources attempted and unavailable in this session:
- TikTok Community Guidelines Enforcement Reports at https://www.tiktok.com/transparency/ . Every request returned a connection failure, so no TikTok report is named or cited anywhere in this post.
- transparency.meta.com body content. The host returned either an error page or a shell with no report content under three different user agents.