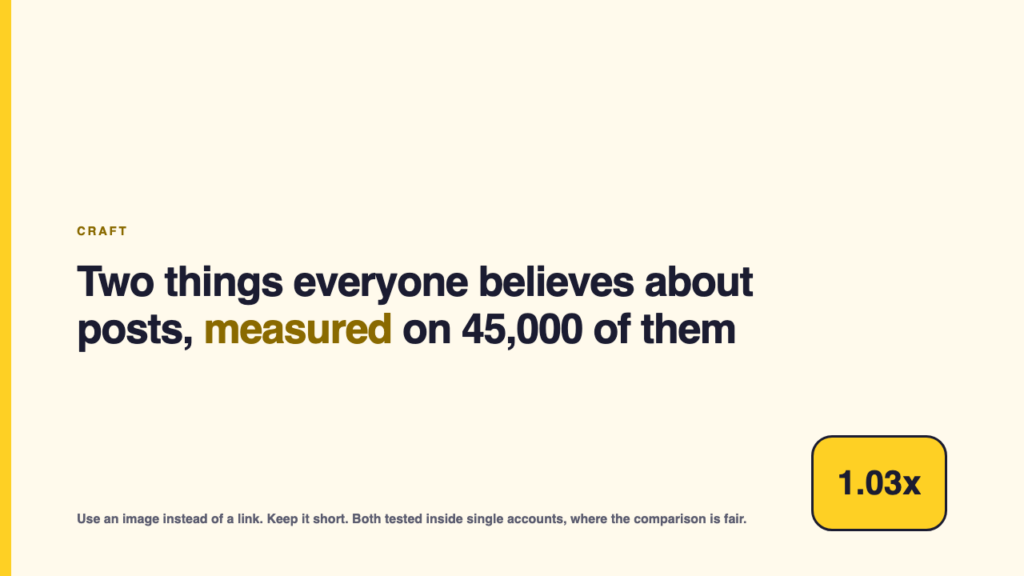
Two pieces of advice show up in every social media guide ever written. Use an image instead of a link. Keep it short.
Both are testable against real accounts rather than against an anecdote, so I tested them. Over the 90 days to 5 September 2026 I collected every post published by 60 public brand and publisher accounts on Bluesky, from the public API: 45,026 posts, each with its own like, repost, reply and quote counts.
The important part of the method is that every comparison happens inside a single account. Comparing image posts at one brand with link posts at another measures the brands, not the format. Comparing an account against itself is the only version of this question worth asking.
Neither belief survives.
Belief one: images beat link cards
Fourteen accounts in the set published at least 25 link card posts and at least 25 image posts in the window, which is enough to compare them against themselves.
| Account | Link card posts | Median engagement | Image posts | Median engagement | Image versus link |
|---|---|---|---|---|---|
| The New York Times | 1,881 | 69 | 280 | 76 | 1.09x |
| Reuters | 2,360 | 17 | 38 | 20 | 1.15x |
| Bloomberg | 2,070 | 26 | 318 | 17 | 0.65x |
| The Verge | 1,674 | 30 | 69 | 123 | 4.10x |
| Rolling Stone | 217 | 48 | 330 | 43 | 0.90x |
| IGN | 62 | 24 | 245 | 24 | 1.00x |
| The Atlantic | 1,992 | 44 | 320 | 40 | 0.90x |
| The New Yorker | 1,852 | 23 | 216 | 70 | 3.02x |
| The Wall Street Journal | 2,180 | 16 | 268 | 17 | 1.06x |
| The Economist | 2,217 | 8 | 272 | 6 | 0.81x |
| The Associated Press | 2,250 | 90 | 29 | 174 | 1.93x |
| Semafor | 1,146 | 6 | 265 | 8 | 1.33x |
| Netlify | 45 | 1 | 68 | 1 | 1.00x |
| EFF | 437 | 129 | 67 | 72 | 0.56x |
The median account gets 1.03 times the engagement from an image post that it gets from a link card. Three percent. Seven of the fourteen accounts do better with images, seven do better with links.
There are two real exceptions, and they are large. The Verge gets 4.1 times more from an image post than a link card. The New Yorker gets 3.0 times. The Associated Press gets 1.9. On the other side, EFF gets 0.56 times, which is to say its link posts do nearly twice what its image posts do, and Bloomberg is at 0.65.
So the honest version of the advice is not “use images”. It is: this varies enormously by account and you cannot know your own answer without checking. Two of these accounts would be leaving three quarters of their engagement on the table by posting links, and two others would lose by switching to images. The population median tells you nothing about which of those you are.
That check is not difficult. Split your last 90 days by whether the post carried an uploaded image or a link preview, take the median of each, and look at the ratio. If it is near 1.0, the format is not your lever and you can stop thinking about it.
Belief two: shorter posts do better
For each of the 29 accounts with at least 150 posts, I ranked its posts by the length of the post text and by engagement, and measured how closely the two rankings agree.
The median account has a rank correlation of +0.10 between length and engagement, and 26 of the 29 accounts are positive. Positive means longer posts do slightly better, which is the opposite of the advice.
Ten percent of a rank correlation is close to nothing, and nobody should rewrite their posting style around it. The point is the direction and the consistency: if brevity helped, this number would be negative, and it is positive on 26 of 29 accounts.
Three accounts are meaningfully positive: 404 Media at +0.34, The New Yorker at +0.34, Nature at +0.31. One is meaningfully negative: Crunchyroll at -0.22, an account whose median post is 69 characters long and whose audience is there for images.
The most useful way to read this is that length is a symptom, not a cause. A post that needs 200 characters usually has something to say. A post that fits in 60 is often a headline and a link. The correlation is picking up the difference between those two things, not a preference for typing more.
What the data says the lever actually is
If format is a three percent effect and length is a ten percent rank correlation, the obvious question is where the variation actually comes from. The same dataset answers that, in the distribution of engagement inside an account: the median account in this collection earns half of everything it gets from its best 17.5 percent of posts, and one account earns half from 0.9 percent.
The gap between an account’s best post and its median post is routinely a factor of a hundred or more. The gap between its image posts and its link posts is three percent.
That is the whole answer. Choosing the format is not the work. Having something worth posting is the work, and no format setting rescues a post nobody wanted.
What this cannot tell you
- One platform, 90 days, one collection date, accounts weighted towards news and technology publishers. The format economics of Instagram or LinkedIn are a different question and this says nothing about them.
- This is observational, not an experiment. Nobody randomised which stories got images. If an account reserves images for its biggest stories, its image ratio will look high for reasons that have nothing to do with the format.
- Engagement here is likes, reposts, replies and quotes. Impressions are not exposed by this platform, so none of this measures reach, and a format that gets more impressions but fewer interactions would look worse here.
- Length is measured in characters of post text and takes no account of what the text says.
- Nine high volume accounts hit the collection page cap, so their windows are shorter than 90 days. Within-account comparisons are unaffected.
- Counts move. Everything here is as read on 5 September 2026.
Source ledger
- Post records: the public Bluesky AppView API (
public.api.bsky.app), endpointsapp.bsky.actor.getProfileandapp.bsky.feed.getAuthorFeed, read without authentication on 5 September 2026. 60 accounts, 45,026 posts. The format comparison uses the 14 accounts with at least 25 posts of each type; the length comparison uses the 29 accounts with at least 150 posts. - Post type is read from the embed on the record itself: an uploaded image, an external link card, a video, or none.
- Replies by the account are excluded from both comparisons.