An agency strategist is building the reach slide for a US client pitch and finds Instagram at 51% in one survey and at 54% in another. The pitch is on Thursday, and the client’s marketing director will ask where the number came from. The scenario is hypothetical.
How many Americans use social media? Edison Research’s The Infinite Dial 2026 puts it at 85% of Americans aged 12 and older, which Edison estimates at 246 million people. Pew Research Center’s 2026 survey publishes no single “any social media” figure; it reports each platform on its own, led by YouTube (84% of US adults) and Facebook (70%). Every US social media use figure on a slide comes from one of these surveys, or from a roundup that copied one, and each survey asked a different question of different people.
This piece is a reading of three primary survey publications: Pew Research Center’s adult social media fact sheet and report, Pew’s teen survey, and Edison Research’s The Infinite Dial 2026. All eleven sources were first read on 2026-10-20 and re-read on 2026-11-04, when every figure below was checked against the toplines. No statistics roundups and no platform-reported user counts were used.
Pew’s 2026 survey of 5,511 US adults puts YouTube at 84%, Facebook at 70% and Instagram at 51% who say they “ever use” each. Edison’s January 2026 survey of 2,050 Americans aged 12 and older puts Facebook at 68% and Instagram at 54% who “currently use” each. The two surveys asked different people different questions, so their figures differ without either one being wrong.
Three surveys, three different questions
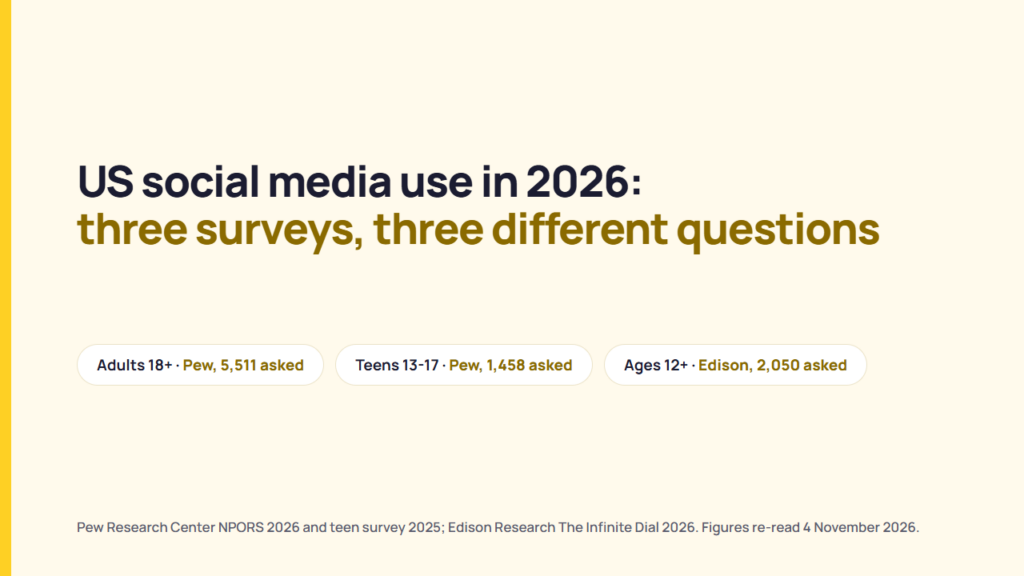
The three surveys most often behind US platform-use figures ask different populations different questions. Pew runs two adult surveys, one for whether people use a platform and one for how often, plus a separate teen survey. Edison’s Infinite Dial asks Americans aged 12 and older.
| Survey | Who was asked | Fieldwork | Sample and mode | Margin of error | Question asked |
|---|---|---|---|---|---|
| Pew, National Public Opinion Reference Survey (NPORS) 2026 | US adults 18+ | Jan. 30 to June 18, 2026 | 5,511 adults from a random sample of addresses, run by SSRS: 2,473 online, 2,694 on paper, 344 by phone, in English and Spanish. Response rate 30% (AAPOR RR1) | ±1.8 points | “Please indicate whether or not you ever use the following websites or apps.” |
| Pew, American Trends Panel Wave 164 | US adults 18+ | Feb. 24 to March 2, 2025 | 5,123 panel members, online or by live phone | ±1.6 points | “About how often do you visit or use…?” for Facebook, YouTube, X and TikTok, asked of each platform’s users |
| Pew, teen survey 2025 | US teens 13 to 17 who live with a parent | Sept. 25 to Oct. 9, 2025 | 1,458 teens online, recruited through parents in Ipsos’s KnowledgePanel | ±3.3 points | “Do you ever use any of the following apps or sites?” |
| Edison Research, The Infinite Dial 2026 | Americans 12+ | January 2026 | 2,050 people online: half from the probability-based SSRS Opinion Panel and half from a non-probability sample, weighted to the US 12+ population | Not published in the pages read | Chart label: “% currently use social media brand”. The full question text is not published in the pages read. |
Sources: Pew 2026 NPORS methodology and questionnaire; Pew 2025 ATP and teen toplines; Edison’s Infinite Dial 2026 presentation. Read 2026-11-04. Full list under Sources.
Pew’s NPORS fits a claim about US adults. The NPORS does not fit any claim that includes teenagers, because Pew does not ask anyone under 18 in that survey. Pew covers teens in a separate survey, described below.
What Pew’s adult survey reports
Pew’s 2026 fact sheet, published 19 October 2026, reports YouTube (84%) and Facebook (70%) as the most widely used platforms among US adults, with Instagram at 51%. Every figure in the table is the share of all US adults who say they ever use the platform.
| Platform | 2026 (Jan. 30 to June 18) | 2025 (Feb. 5 to June 18) |
|---|---|---|
| YouTube | 84% | 84% |
| 70% | 71% | |
| 51% | 50% | |
| TikTok | 37% | 37% |
| 33% | 32% | |
| 31% | Not asked (32% in 2024) | |
| Snapchat | 26% | 25% |
| 25% | 26% | |
| X (formerly Twitter) | 18% | 21% |
| Nextdoor | 18% | Not asked |
| Truth Social | 4% | 3% |
| Threads | Not asked | 8% |
| Bluesky | Not asked | 4% |
| Not asked | Not asked (36% in 2024, fieldwork Feb. 1 to June 10, 2024) |
Source: Pew Research Center, “Americans’ Use of Social Media in 2026” fact sheet and its 2026 topline; 2025 NPORS topline. Read 2026-11-04.
Pew’s topline also reports each platform on a second base, internet users only (5,313 respondents in 2026). On that base, YouTube is 87% and Facebook 72%, against 84% and 70% of all adults. The fact sheet uses the all-adult figures, and a slide should too unless it says “internet users”.
Pew’s long trend line carries a break. Pew’s fact sheet notes that polls from 2012 to 2021 were done by phone, 2023 by web and mail, and 2024 to 2026 by web, mail and phone. Pew’s 2025 report says that when comparing with data from before 2023, “we take a cautious approach”. A slide that plots Instagram from 2019 to 2026 as one smooth line crosses that break without saying so.
Consider a freelancer pitching a home-goods brand that wants a Pinterest reach figure. Pew’s survey asked no Pinterest item in 2025 or 2026, so Pew’s latest Pinterest figure is 36% of adults, from 2024. Edison’s January 2026 figure is 35% of Americans aged 12 and older. Either figure can go on the slide, provided the slide names the survey, the year and the population. That last point is a reading of the published tables, not a statement from Pew or Edison.
Social media use by age: how much the figure moves
Pew’s 2026 age breakdown shows the widest gaps on Instagram, TikTok and Snapchat. The table gives the share in each age group who say they ever use each platform.
| Platform | 18-29 | 30-49 | 50-64 | 65+ |
|---|---|---|---|---|
| YouTube | 95% | 91% | 85% | 65% |
| 69% | 78% | 71% | 59% | |
| 79% | 64% | 41% | 21% | |
| TikTok | 65% | 45% | 31% | 11% |
| Snapchat | 56% | 33% | 13% | 4% |
| 41% | 37% | 32% | 13% | |
| 40% | 35% | 18% | 6% | |
| 37% | 39% | 36% | 20% | |
| X (formerly Twitter) | 31% | 20% | 17% | 7% |
Source: Pew Research Center, “Americans’ Use of Social Media in 2026”, survey of US adults conducted Jan. 30 to June 18, 2026. Read 2026-11-04.
Pew reports age bands, not generations, so a “Gen Z” or “millennial” figure on a slide comes from a different survey. Pew’s 2026 methodology gives 540 respondents and ±5.3 points for ages 18 to 29, 1,569 and ±3.2 for 30 to 49, 1,379 and ±3.5 for 50 to 64, and 1,967 and ±2.8 for 65 and older.
An agency pitching a retirement-community client should cite “21% of US adults 65 and older say they ever use Instagram (Pew, 2026, ±2.8 points)”, not the 51% all-adult figure. Facebook is the clearest case of an older group leading, with 78% of adults 30 to 49 against 69% of adults 18 to 29. Pew’s fact sheet also splits each platform by gender, race and ethnicity, income, education, community type and party. This piece does not reproduce those splits.
Edison reports age in three bands, 12 to 34, 35 to 54 and 55 and older, and its summary slide says TikTok is the platform used most often by Americans 12 to 34 and Facebook by those 55 and older. Pew’s 18 to 29 band and Edison’s 12 to 34 band overlap but do not match, so the two age tables cannot be laid side by side.
Daily use is a different number
Pew’s frequency figures come from a separate survey, American Trends Panel Wave 164, fielded Feb. 24 to March 2, 2025 among 5,123 adults, and cover four platforms only. Pew’s 2026 fact sheet has no frequency figures, so the 2025 panel is the newest Pew daily-use data read for this piece.
Pew’s 2025 report says “About half of U.S. adults say they visit each of these platforms at least once a day,” meaning Facebook and YouTube, and that this “includes 37% who visit Facebook several times a day, and 33% who say the same of YouTube.” The same report says “About a quarter (24%) say they are daily users of TikTok. Fewer (10%) report daily use of X.”
| Platform | All adults: several times a day | All adults: about once a day | Users only: several times a day | Users only: about once a day |
|---|---|---|---|---|
| 37% | 15% | 53% (of 3,715 users) | 21% | |
| YouTube | 33% | 15% | 39% (of 4,475 users) | 18% |
| TikTok | 19% | 5% | 51% (of 1,548 users) | 14% |
| X (formerly Twitter) | 6% | 4% | 30% (of 1,297 users) | 18% |
Source: Pew Research Center, American Trends Panel Wave 164 topline, Feb. 24 to March 2, 2025. Read 2026-11-04.
The two halves of the table describe the same respondents on two bases. Adding Pew’s two users-only rows gives 65% of TikTok users on TikTok at least once a day, while the all-adult rows give 24% of adults. That is a reading of the topline, not a statement from Pew. A slide that says “65% use TikTok daily” has quietly swapped “of TikTok users” for “of Americans”.
Age changes the daily figures too. Pew reports that “Roughly half of 18- to 29-year-olds say they go on TikTok at least once a day, compared with just 5% of adults ages 65 and older,” and that 58% of adults 30 to 49 and 54% of adults 50 to 64 go on Facebook daily. Pew’s frequency survey asked nothing about Instagram, LinkedIn or Pinterest, so no Pew daily figure exists for those three.
None of the three surveys reports minutes or hours per day. Pew’s categories stop at “several times a day” and “almost constantly”, and Edison’s slides report use in the last week or month. A figure for how long the average American spends on social media each day comes from a different kind of source, usually a measurement panel or a platform’s own data, and should be cited as such.
What the teen survey reports
Pew’s teen survey of 1,458 teens ages 13 to 17, fielded Sept. 25 to Oct. 9, 2025, puts YouTube at 92%, and it describes a separate population from the adult survey.
| Platform | Ever use | Daily | Almost constantly |
|---|---|---|---|
| YouTube | 92% | “Roughly three-quarters” | 17% |
| TikTok | 68% | 61% | 21% |
| 63% | 55% | 12% | |
| Snapchat | 55% | 46% | 12% |
| 31% | 20% | 3% | |
| 24% | Not asked | Not asked | |
| 17% | Not asked | Not asked | |
| X (formerly Twitter) | 16% | Not asked | Not asked |
Source: Pew Research Center, “Teens, Social Media and AI Chatbots 2025” report and topline; all figures on the all-teen base. Read 2026-11-04.
Pew’s teen trend lines move differently from the adult ones. Pew reports Facebook at 31% of teens now against 71% in 2014-15, X at 16% against 23% in 2022 and 33% in 2014-15, and WhatsApp at about a quarter of teens, up from 17% in 2022. Pew also reports that 40% of teens say they are online “almost constantly”.
A client who says “nobody uses Facebook anymore” after a teen headline is reading the 31% teen figure. Pew’s adult figure for Facebook is 70%. Both figures are Pew’s and they describe different people. What a platform does with the teens it can identify is a separate question, covered in what Meta says about Instagram teen settings and brand posts.
Why Pew and Edison disagree
Edison puts any social media use at 85% of Americans aged 12 and older. Edison’s figures run higher than Pew’s for most platforms the two surveys share, and neither publisher explains the other’s figure. The table sets the two side by side without combining them.
| Platform | Pew 2026: US adults 18+, ever use | Edison Jan. 2026: Americans 12+, currently use |
|---|---|---|
| 70% | 68% | |
| 51% | 54% | |
| TikTok | 37% | 42% |
| 25% | 38% | |
| Not asked (36% in 2024) | 35% | |
| 31% | 34% | |
| Snapchat | 26% | 31% |
| X (formerly Twitter) | 18% | 30% |
| Threads | Not asked (8% in 2025) | 15% |
| Truth Social | 4% | 6% |
| Bluesky | Not asked (4% in 2025) | 5% |
| YouTube | 84% | Reported separately: 91% ever used, 84% in the last month, 78% in the last week |
Sources: Pew Research Center, “Americans’ Use of Social Media in 2026” and earlier toplines; Edison Research, The Infinite Dial 2026 presentation. Read 2026-11-04. Edison also reports Discord at 21% and Mastodon at 2%, and Pew asks neither.
The published methods show four differences between the two surveys:
- Population: Edison’s Infinite Dial includes ages 12 to 17, and Pew’s NPORS starts at 18.
- Wording: Pew asks whether people “ever use” a platform, and Edison’s chart reports who “currently use” a platform.
- Sample and mode: Edison’s survey is online only, with half the sample from a non-probability source, while Pew offers web, paper and phone to a random sample of addresses.
- Timing: Edison fielded in January 2026, and Pew’s fieldwork ran from Jan. 30 to June 18, 2026.
Neither publisher’s pages attribute any gap to any one of those four differences, so the 18% against 30% gap on X has no documented cause. That is a reading of the published methods, not a statement from Pew or Edison.
Edison also reports that Facebook is the platform 40% of social media users use most often. The same rule for why one account’s analytics report different numbers holds here: name the source and the definition, and the gap stops looking like an error.
Consider an agency whose X slide says “30% of Americans use X” while the client’s board pack quotes 18%. The agency’s slide should read “Americans 12+ who currently use X: 30% (Edison Research, The Infinite Dial 2026, January 2026)”, and the board pack’s line should read “US adults who ever use X: 18% (Pew, 2026)”. Both lines are then accurate, and neither needs defending against the other.
Citing a survey figure in a client deck
Eight questions sort a survey figure before it goes on a client’s slide.
| Question | What the slide or footnote needs |
|---|---|
| 1. Who published it? | The publisher’s name and the survey’s name, such as Pew Research Center, National Public Opinion Reference Survey. |
| 2. Who was asked? | US adults 18+, teens 13 to 17, or Americans 12+. A teen figure never stands in for “Americans”. |
| 3. When was it fielded? | The fieldwork dates, not the publication date alone. Pew’s 2026 adult figures come from Jan. 30 to June 18, 2026. |
| 4. How many people, and how? | The sample size and mode: 5,511 adults by web, paper and phone for Pew; 2,050 people online for Edison. |
| 5. What exactly was asked? | “Ever use”, “currently use”, or a frequency such as “several times a day”. |
| 6. Is the base everyone or only users? | A share of all adults and a share of a platform’s users are different figures. Pew’s topline states the base above each table. |
| 7. What is the margin of error? | ±1.8 points for Pew’s 2026 adults, wider for age groups. Edison’s pages read publish none, so the slide says so. |
| 8. Is a newer edition out? | Pew updated its adult figures on 19 October 2026. A deck built on the November 2025 report is a year behind. |
A footnote that answers all eight questions fits on one line: “Pew Research Center, National Public Opinion Reference Survey, Jan. 30 to June 18, 2026, 5,511 US adults, web, paper and phone, ±1.8 points. Share who say they ever use Instagram: 51%. Published 19 October 2026.” This is the same rule applied to engagement-rate benchmarks: a figure without its publisher, date, sample and definition is not ready for a client.
Survey shares and platform-reported user counts measure different things, and this piece covers only the surveys. Which survey fits a deck depends on the client’s audience and on whether the claim is about reach or about daily habit, and that choice belongs to the people who build the deck.
What could not be confirmed
This reading cannot settle ten points:
- Edison’s full question wording and a margin of error were not published in the presentation read.
- Edison’s exact fieldwork days in January 2026 were not stated.
- Pew asked no Pinterest item in 2025 or 2026, and no Threads or Bluesky item in 2026.
- Pew’s 2026 fact sheet carries no daily-use figures. The newest Pew daily figures read come from Feb. 24 to March 2, 2025.
- No 2026 Pew teen report had been published on 2026-11-04. Pew’s teen reports have appeared in December in recent years.
- Neither Pew nor Edison explains the gaps between the two surveys’ figures.
- Pew’s teen report gives 20% for daily Facebook use, while the topline rows on the all-teen base add to 19%, a rounding difference.
- None of the three surveys reports time spent per day.
- US Census and NTIA internet-use data were not read for this piece.
- None of these surveys counts accounts or brand pages. All of them ask people.
FAQ
How many Americans use social media?
Edison Research’s The Infinite Dial 2026 reports that 85% of Americans aged 12 and older currently use social media, which Edison estimates at 246 million people. Pew’s 2026 adult survey publishes no combined “any social media” figure; its highest single-platform figures are YouTube at 84% and Facebook at 70% of US adults.
Which social media platforms are most used in the US?
By Pew’s 2026 survey of US adults, the order is YouTube (84%), Facebook (70%), Instagram (51%), TikTok (37%), WhatsApp (33%) and LinkedIn (31%). By Edison’s January 2026 survey of Americans aged 12 and older, it is Facebook (68%), Instagram (54%), TikTok (42%), Reddit (38%), Pinterest (35%) and LinkedIn (34%), with YouTube reported separately at 91% ever used. Edison also reports Facebook as the platform used most often, named by 40% of social media users.
What percentage of Americans use YouTube and Facebook?
Pew’s 2026 survey of 5,511 US adults puts YouTube at 84% and Facebook at 70% who say they ever use them. Edison’s January 2026 survey of Americans aged 12 and older shows Facebook at 68% who currently use it and YouTube at 91% who have ever used it.
Why do Pew and Edison give different numbers for the same platform?
Pew and Edison asked different people different questions. Pew’s NPORS asks US adults whether they ever use a platform, by web, paper or phone; Edison asks Americans aged 12 and older, online, which platforms they currently use. Neither publisher attributes the gaps to a specific cause.
Does Pew measure Pinterest, Threads or Bluesky?
Pew’s 2026 survey did not ask about any of the three. Pew’s latest figures are Pinterest 36% (2024), Threads 8% (2025) and Bluesky 4% (2025). Edison’s January 2026 figures for Americans aged 12 and older are Pinterest 35%, Threads 15% and Bluesky 5%.
Can I combine Pew and Edison figures on one slide?
A slide can show both only with each figure labelled by survey, population and wording. Averaging a Pew figure with an Edison figure produces a number neither survey measured.
Sources
Publisher, title, URL. First read 2026-10-20, re-read 2026-11-04.
- Pew Research Center, “Americans’ Use of Social Media in 2026” (fact sheet, 19 October 2026), pewresearch.org.
- Pew Research Center, 2026 NPORS topline, pewresearch.org (PDF).
- Pew Research Center, 2026 NPORS questionnaire, pewresearch.org (PDF).
- Pew Research Center, 2026 NPORS methodology, pewresearch.org (PDF).
- Pew Research Center, “Americans’ Social Media Use 2025” (20 November 2025), pewresearch.org.
- Pew Research Center, 2025 NPORS topline, pewresearch.org (PDF).
- Pew Research Center, American Trends Panel Wave 164 topline, pewresearch.org (PDF).
- Pew Research Center, “Teens, Social Media and AI Chatbots 2025” (9 December 2025), pewresearch.org.
- Pew Research Center, 2025 teen survey topline, pewresearch.org (PDF).
- Edison Research, “The Infinite Dial 2026” presentation (March 2026), edisonresearch.com (PDF).
- Edison Research, “The Infinite Dial 2026” page, edisonresearch.com. On 2026-11-04 this address redirected to ssrs.com/insights/the-infinite-dial-2026/; the presentation names the publisher as Edison Research at SSRS.