Someone on the call has the app open on their phone. Your report went out that morning, its number is lower, and they want to know which one is right. The honest answer, that both are probably correct, sounds like an excuse without a reason.
The question you cannot answer with a source of truth
The standard advice is to pick one source of truth and report from it consistently. That makes the report internally consistent and leaves you unable to explain the number on the stakeholder’s screen, which is the number being questioned.
A gap between two surfaces of the same platform is usually a documented consequence of counting rules, not a bug and not your mistake. There is no universal reconciliation formula. The goal is diagnosis, naming which mechanism is in play, not making the numbers equal.
Some metrics count events and some count people
An event metric increments every time something happens. A person metric collapses repeats, so the same account acting twice adds one, not two. Google’s Analytics Data API schema puts both shapes side by side: eventCount is the count of events, activeUsers the number of distinct users who visited your site or app.
The consequence follows from the word distinct. Split a person-counting result into segments and anyone in two of them is counted once in each part and once in the total, so the parts come out larger than the whole. The same schema defines active1DayUsers, active7DayUsers and active28DayUsers as distinct active users within a 1 day, 7 day and 28 day period.
The tell: if the gap grows as you widen the date range, suspect deduplication, since a longer window holds more repeats to collapse. No published figure for the size of that gap was found, so refuse any rule of thumb.
The window is part of the metric, not a filter on it
A metric defined over a fixed window is a different metric from the same name over a different window. The one, seven and 28 day active user metrics are that fact written into three names, so two surfaces with different default windows are not contradicting each other. Hence the boundary effect: activity from a post near the edge of a range falls inside one window and outside another, so surfaces disagree most on recent posts and converge as posts age.
Google’s sessions documentation states the principle plainly, ending a session after 30 minutes of user inactivity by default. The unit is created by a rule about time, not only by traffic. So find each surface’s documented default window before comparing anything, and where none is documented, say so.
Whose midnight the day ends at
A surface has to decide which calendar day an event belongs to, and there are three candidate clocks: the account or property time zone, UTC, and a fixed time zone an API imposes regardless of either. Google’s BigQuery export schema puts two in one table: event_date is the date the event was logged, in the registered time zone of the app, and event_timestamp is the time it was received, in microseconds, UTC. Two clocks, one export, and a daily total that depends on the field you group by.
The signature is easy to recognise: daily figures differ while multi week totals nearly agree, because the events are filed under the adjacent day rather than lost. The YouTube Analytics API data model documentation, where a reporting time zone would sit, states none.
Same metric name, different definition
A metric name is scoped to an API version and to a report type, so the name survives while its definition or availability changes underneath it. YouTube’s metrics reference says of views, a core metric, that it represents different numbers in different types of reports, and it defines engagedViews separately as views past the initial seconds.
The revision history is the record. On March 9, 2026 the ageGroup dimension was changed to include users the platform estimates to be under 18 years old. On June 25, 2026 the user activity by city report was removed for content owners, whose queries now return empty results. Neither change renames anything, so a report you did not touch starts answering a different question. When a number moves and nothing changed on your side, read the revision history before your query. A series spanning a definition change is not one series, so mark the break.
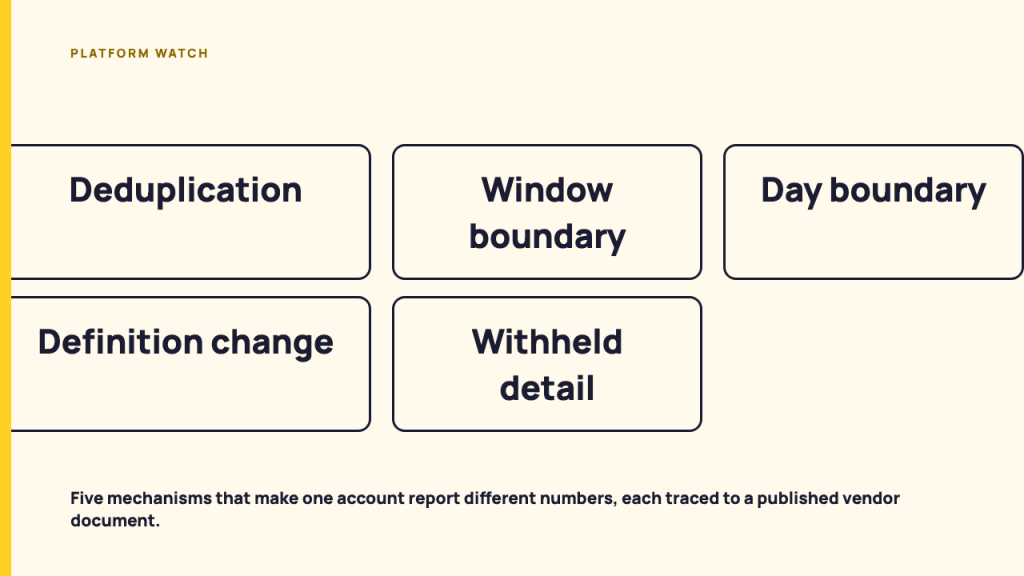
| What you observe | Likely mechanism | Document that confirms it | Check first |
|---|---|---|---|
| Segment rows exceed the total | Deduplication | Metric definition | People or events |
| Disagreement on recent posts only | Window boundary | Documented default window | Each surface’s window |
| Daily figures differ, month matches | Day boundary time zone | Stated time zone of the date field | Which clock each field uses |
| Last quarter’s report now fails | Definition or availability change | Revision history for the period | Version pinned |
| Visible rows sum below the total | Withheld or grouped detail | Row limit and threshold rules | Row limit or minimum |
When a surface is not showing you everything it has
Independent reasons a surface holds detail it does not show you.
- Row limits. Google’s documentation on the (other) row states it appears when a table’s rows exceed the table’s row limit, at which point only the most common dimension values are surfaced and less common values are condensed under that row. A sum of the visible rows falls short of the total.
- Minimum thresholds. Google’s data thresholds page states that data may be withheld from a report to prevent anyone viewing it from inferring the identity or sensitive information of individual users from demographics, interests or other signals. The detail exists. The surface declines to show it.
- Sampling. Google’s data sampling page describes sampling as analysing a subset of all data to uncover the meaningful information in the larger set. Its own title marks it legacy, so take it as an illustration of the mechanism only.
- Latency. YouTube’s data model documentation says a response contains data up to the last day for which every metric in the query was available, so the same query can cover a different range today than it did last week. Whether a finalised value can later be revised, and the window in which it can move, is not stated by any document consulted here, so treat it as undocumented.
A vendor documenting its own disagreement
Google’s comparison of its current and previous analytics products exists to explain why two of its own surfaces return different numbers for the same activity. The older product used Total Users and the current one focuses on Active Users, both displayed as Users, so the word is identical while the calculation is not. The page says it is not unusual for apparent discrepancies in user related data to appear between the two, that they are not a cause for concern, and that they arise because the metrics use slightly different definitions.
Where a vendor publishes a reconciliation document, the gap is a known property of the counting model, which is your licence to stop treating it as a mistake. Same discipline as reading a platform’s own published numbers.
Most social platforms publish no equivalent reconciliation. Their developer references cover the API surface and say nothing about how the in-app view is computed, so you can describe the mechanism but not prove it. That is the difference between what a platform has published and what it has not.
What to say in the meeting, and what to record
The one sentence answer has a fixed shape. Name the surface each number came from, name the counting rule that differs, and say which question each answers, without claiming either is wrong. Hypothetically: the app counts accounts reached, the report counts times the post was seen in the month, so the second is larger and both are correct.
Record four facts beside every reported figure. The surface, named as a specific view or endpoint, not just the platform. The window it covers, with the period value if you requested one. The time zone the day boundary uses, or the word undocumented. And the metric name with its API version where one applies.
Where the mechanism cannot be identified from documentation, report both numbers, name their surfaces, and state that the platform does not document the difference. That is stronger than quietly picking one, because it survives being questioned. Same instinct as what you should be comparing against instead. It does not make the numbers match. It gives the gap a name, and the gap stops being an embarrassment once it has one.
FAQ
Which surface should I report from?
Consistency matters more than the choice, so pick the surface whose documented window and definition match the question, and record that choice. Choosing does not excuse you from explaining the other surface, because that is the one your stakeholder is looking at.
Do the segment numbers not adding up to the total mean the data is broken?
No, and for a person-counting metric it is expected. Google’s Analytics Data API defines its user metrics as counts of distinct users, and a person who falls into two segments is counted once in each and once in the total, so the parts come out larger than the whole.
Why do my daily numbers differ but the monthly total is nearly the same?
Look at the day boundary. Two surfaces can assign the same event to different calendar days depending on the clock each uses, so events move to the adjacent day rather than disappearing, which is why the daily rows argue and the month agrees. Easiest of these to diagnose, and the least worth escalating.
A number I reported last week has changed. Was I wrong?
A figure is accurate as of when it was read, which is why the read date belongs beside it in the report. No document consulted here publishes a revision window for a figure already finalised, so call the movement undocumented rather than an error.
Is there a way to make the surfaces agree?
Usually not, and that is not the goal. Aligning the window, the time zone and the metric version moves the numbers closer. A person-counting metric and an event-counting metric will not converge, because they answer different questions.
Sources
- Google, Analytics Data API schema, fetched 2026-08-26
- Google, About Analytics sessions, fetched 2026-08-26
- Google, BigQuery Export schema, fetched 2026-08-26
- Google, About the (other) row, fetched 2026-08-26
- Google, About data thresholds, fetched 2026-08-26
- Google, About data sampling (legacy), fetched 2026-08-26
- Google, Comparing Google Analytics and Universal Analytics metrics, fetched 2026-08-26
- YouTube Analytics API metrics reference, fetched 2026-08-26
- YouTube Analytics API data model, fetched 2026-08-26
- YouTube Analytics API revision history, fetched 2026-08-26