Every social media report contains a number called engagement rate, and almost none of them say which one. This matters more than it sounds, because the phrase covers at least five different calculations that are all defensible, all in common use, and all produce a different answer from the same data.
I had a dataset lying around that could settle what “different” means here. Over the 90 days to 5 September 2026 I collected every post published by a set of public brand and publisher accounts on Bluesky, straight from the public API. For this piece I use the 22 accounts in that collection that published at least 50 original posts, have at least 1,000 followers, and whose full 90 days fit inside the collection limit. Replies are excluded, reposts are excluded, and every account is measured on exactly the same posts.
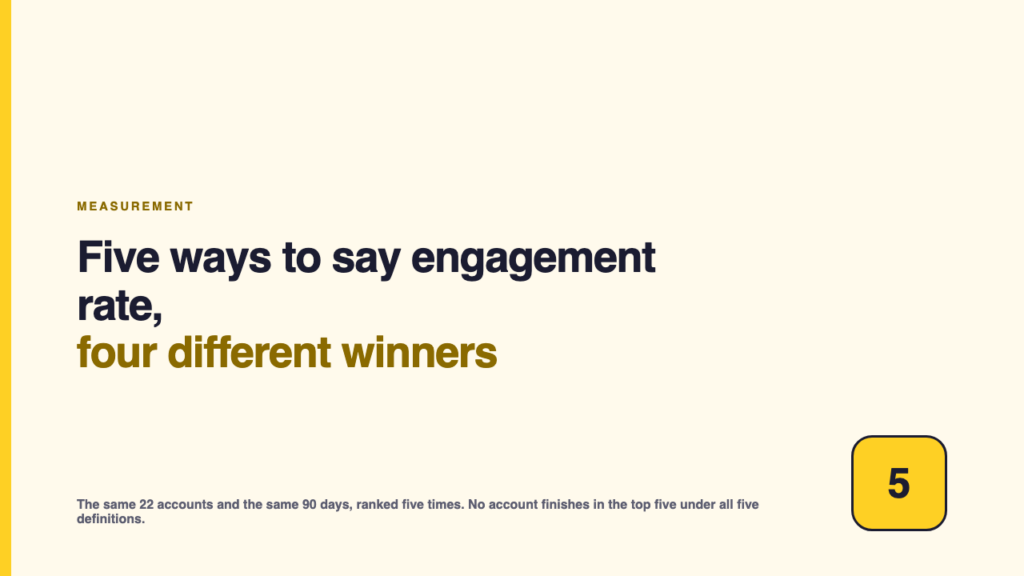
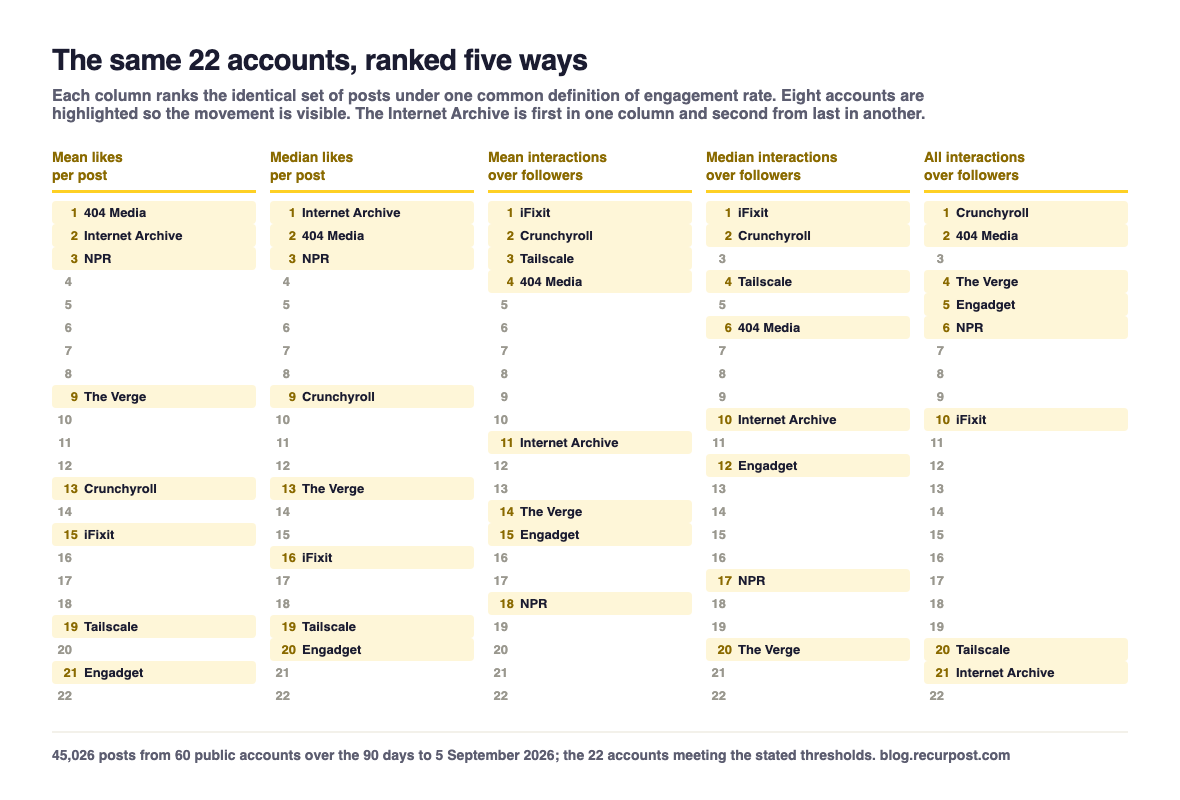
Then I ranked those 22 accounts five times, using five definitions any social team would recognise.
Four different accounts come first. No account is in the top five under all five definitions.
The five definitions
- Mean likes per post. Total likes divided by number of posts. The default in most spreadsheets.
- Median likes per post. The middle post. Same inputs, different summary.
- Mean interactions per post, over followers. Likes, reposts, replies and quotes added up, averaged per post, expressed as a percentage of the follower count. This is the classic “engagement rate” of the marketing literature.
- Median interactions per post, over followers. Definition 3 with the median instead of the mean.
- All interactions in the window, over followers. Everything the account earned in 90 days, over the follower count. The one that rewards volume, and the closest thing to “how much conversation did this account generate”.
Definitions 3 and 5 differ only in whether you divide by the number of posts. That single choice moves accounts by twenty places.
| Account | Posts in 90 days | Followers | 1. Mean likes | 2. Median likes | 3. Mean interactions over followers | 4. Median interactions over followers | 5. All interactions over followers |
|---|---|---|---|---|---|---|---|
| iFixit | 55 | 4,092 | 29 (#15) | 16 (#16) | 0.836% (#1) | 0.440% (#1) | 46.0% (#10) |
| Crunchyroll | 204 | 9,374 | 37 (#13) | 34 (#9) | 0.451% (#2) | 0.416% (#2) | 92.0% (#1) |
| Tailscale | 52 | 6,217 | 11 (#19) | 7 (#19) | 0.214% (#3) | 0.129% (#4) | 11.1% (#20) |
| 404 Media | 449 | 247,853 | 265 (#1) | 155 (#2) | 0.160% (#4) | 0.093% (#6) | 71.7% (#2) |
| PlayStation | 121 | 170,168 | 139 (#5) | 121 (#4) | 0.148% (#5) | 0.129% (#3) | 17.9% (#17) |
| Wikipedia | 150 | 57,176 | 60 (#11) | 53 (#7) | 0.126% (#6) | 0.110% (#5) | 18.9% (#16) |
| NBA | 585 | 119,946 | 122 (#6) | 48 (#8) | 0.121% (#7) | 0.048% (#8) | 71.1% (#3) |
| EFF | 540 | 164,322 | 107 (#7) | 88 (#5) | 0.093% (#8) | 0.074% (#7) | 50.2% (#8) |
| Axios | 383 | 132,298 | 76 (#10) | 34 (#11) | 0.092% (#9) | 0.047% (#9) | 35.4% (#12) |
| Rolling Stone | 635 | 170,349 | 100 (#8) | 34 (#10) | 0.084% (#10) | 0.026% (#14) | 53.3% (#7) |
| Internet Archive | 123 | 433,725 | 258 (#2) | 163 (#1) | 0.079% (#11) | 0.047% (#10) | 9.7% (#21) |
| Netlify | 180 | 2,260 | 1 (#22) | 0 (#22) | 0.071% (#12) | 0.044% (#11) | 12.7% (#19) |
| Wired | 1,033 | 467,753 | 144 (#4) | 74 (#6) | 0.044% (#13) | 0.022% (#16) | 45.1% (#11) |
| The Verge | 1,753 | 361,674 | 98 (#9) | 23 (#13) | 0.039% (#14) | 0.009% (#20) | 69.2% (#4) |
| Engadget | 1,633 | 15,127 | 5 (#21) | 4 (#20) | 0.038% (#15) | 0.033% (#12) | 62.0% (#5) |
| Ars Technica | 1,221 | 159,647 | 43 (#12) | 30 (#12) | 0.038% (#16) | 0.026% (#15) | 46.1% (#9) |
| Nature | 786 | 93,532 | 25 (#16) | 19 (#15) | 0.037% (#17) | 0.027% (#13) | 28.8% (#14) |
| NPR | 2,204 | 1,008,430 | 199 (#3) | 151 (#3) | 0.028% (#18) | 0.021% (#17) | 60.6% (#6) |
| Semafor | 1,420 | 42,041 | 5 (#20) | 4 (#21) | 0.023% (#19) | 0.014% (#18) | 32.6% (#13) |
| Vox | 505 | 230,053 | 17 (#18) | 13 (#17) | 0.011% (#20) | 0.009% (#19) | 5.7% (#22) |
| TechCrunch | 1,452 | 268,912 | 21 (#17) | 12 (#18) | 0.011% (#21) | 0.006% (#21) | 16.3% (#18) |
| The New Yorker | 2,071 | 412,731 | 30 (#14) | 19 (#14) | 0.010% (#22) | 0.006% (#22) | 20.3% (#15) |
The same account, first and last
The Internet Archive is first on median likes per post and twenty first of twenty two on total interactions over followers.
Nothing about the account changed between those two lines. It posts about 1.4 times a day, and each of those posts lands hard: a median of 163 likes against 433,725 followers. Divide by posts and it looks exceptional. Add up 90 days of activity and divide by an enormous follower count, and it looks like the worst performer in the set, because it did not post enough to accumulate.
The Verge runs the same trick in reverse. It is ninth on mean likes, thirteenth on median likes, twentieth on median interactions over followers, and fourth on total interactions in the window. It publishes 19.5 times a day. Per post it is unremarkable. In aggregate it is one of the loudest accounts in the set.
Neither ranking is wrong. They answer different questions. The problem is that both get reported as “engagement rate”.
Small accounts win the percentage, big accounts win the count
iFixit has 4,092 followers and is first under both follower-based per-post definitions, at 0.836 percent mean and 0.440 percent median. It is fifteenth and sixteenth on the raw like counts, because 0.44 percent of four thousand people is sixteen likes.
This is the structural bias in every engagement rate with followers in the denominator: it goes down as the account grows, roughly automatically, because reach does not scale with the follower count. Ranking a portfolio of accounts by it will always favour the smallest ones. Ranking them by raw counts will always favour the largest.
If you manage several accounts of different sizes and report one engagement rate across them, you have not measured performance. You have measured which accounts are small.
The mean and the median are not interchangeable
The Verge’s mean post takes 98 likes. Its median post takes 23. The mean is 4.3 times the median.
That is the outlier structure showing up: a handful of posts do enormous numbers and drag the average up, and the average then describes no actual post on the account. Rolling Stone runs at 3.0 times, the NBA at 2.5, Axios at 2.2.
A mean is the right summary when you care about the total, for example when you are estimating how much attention an account earns in a quarter. A median is the right summary when you are answering “what does a post from us normally do”, which is what most people actually mean when they ask.
Reporting one and calling it the other is the most common measurement error in this field, and it is invisible unless you publish both.
What to do about it
- State the definition in the report, every time. One sentence. “Engagement rate here is likes, reposts, replies and quotes per post, divided by followers, using the median.”
- Publish the median and the mean together. The gap between them is the most informative number on the page, because it tells the reader whether the account has a typical post at all.
- Never change the denominator mid report. Comparing an account with a follower-based rate against one with a per-post count is not a comparison.
- Do not benchmark accounts of different sizes against each other on a follower-based rate. Compare each account against its own history under the same definition instead.
- When someone quotes an industry engagement rate at you, ask which of the five it is. The number is close to meaningless without that, and the answer is frequently not available.
What this cannot tell you
- One platform, one 90 day window, one collection date, 22 named accounts weighted towards news and technology publishers. The point being demonstrated is arithmetic and travels; these specific rankings do not.
- Bluesky exposes likes, reposts, replies and quotes. It does not expose impressions, so none of these definitions can be reach based, and the reach based engagement rate that embedded analytics tools show you is not among them.
- Accounts whose 90 days did not fit inside the collection limit of 2,500 posts are excluded here precisely because definition 5 depends on counting everything.
- Follower counts are as displayed on the collection date and take no account of when those followers arrived or whether they are active.
- Counts move. Every number here is as read on 5 September 2026.
Source ledger
- Post records and follower counts: the public Bluesky AppView API (
public.api.bsky.app), endpointsapp.bsky.actor.getProfileandapp.bsky.feed.getAuthorFeed, read without authentication on 5 September 2026. - The full collection is 60 accounts and 45,026 posts over the 90 days to 5 September 2026. This piece uses the 22 accounts meeting the stated thresholds; every one of them is named in the table above and can be recounted from the same public endpoints.
- The alt text study built on the same collection, with the collection rules stated in full, is Alt text is not a spectrum, it is a switch.